Published Sunday, 22 February 2026
Warren Buffett Indicator Stock Market: What It Signals for Singapore Investors
Warren Buffett Indicator Stock Market: What It Signals for Singapore Investors
Market Context
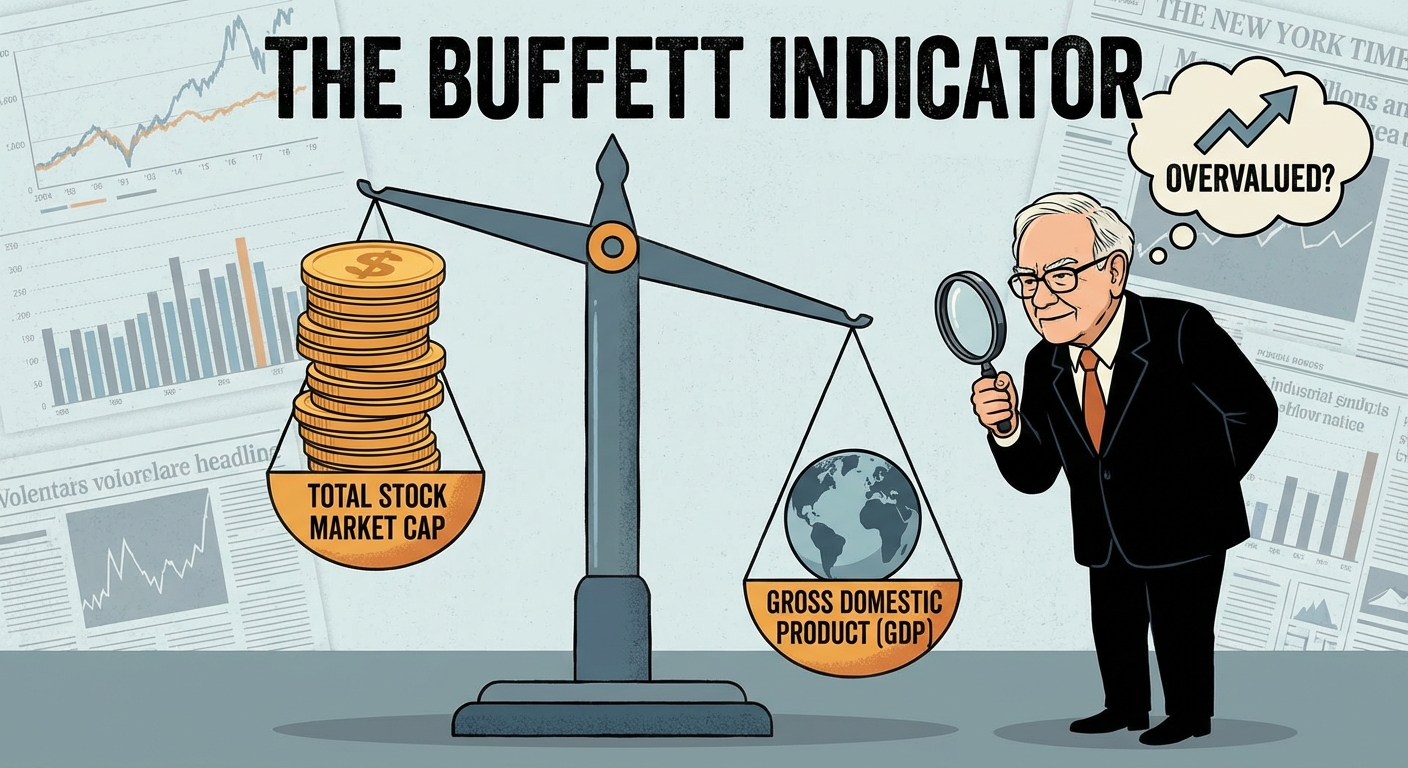
The warren buffett indicator stock market metric compares a country’s total stock market value to its economic output (typically market cap-to-GDP). In broad terms, it is used to gauge whether equities look expensive or cheap versus the size of the economy.
For investors, its appeal is simplicity: a high reading may imply lower forward returns, while a low reading may imply better prospective outcomes. However, it is not a timing tool; it is a valuation lens best used to calibrate expectations and strategy rather than to “call the top”.
Key takeaways:
- It is most useful for setting long-term return assumptions and adjusting risk budgets, not for short-term trading decisions.
- It works best when paired with other indicators (earnings, interest rates, credit conditions, and liquidity) to avoid overconfidence from a single ratio.
Key Drivers
When the indicator is elevated, the risk-return tradeoff shifts: investors may still earn positive returns, but the probability of below-average outcomes increases, especially if valuations compress. Conversely, a depressed reading may point to attractive long-run value, but that often coincides with economic stress—risk is not “gone,” it is merely priced differently.
Common pitfalls include:
- Misapplying it to open economies: For markets like Singapore, listed companies derive significant revenue overseas, so a simple market cap-to-local GDP framing can be misleading.
- Ignoring interest rates: Valuations can stay high when discount rates are low; the indicator alone does not reflect the cost of capital.
- Using it for precise timing: Even if the indicator suggests overvaluation, markets can remain expensive for extended periods.
Investor profile fit:
- Conservative investors may use a high reading to reduce equity concentration and prioritise capital preservation.
- Growth-oriented investors may stay invested but tighten risk controls (e.g., staged entries, rebalancing rules, or quality tilt).
Impact
A practical approach is to treat the indicator as a regime guide—informing how aggressively to take equity risk, not whether to abandon equities entirely.
Possible actions in a higher-valuation regime:
- Increase diversification across geographies and sectors to reduce single-market valuation risk.
- Prefer disciplined rebalancing and dollar-cost averaging over lump-sum buys if volatility risk is elevated.
- Emphasise quality factors (profitability, balance sheet strength) to improve resilience if multiples compress.
Possible actions in a lower-valuation regime:
- Consider increasing equity allocation gradually, aligning with your horizon and drawdown tolerance.
- Focus on broad-market exposure rather than concentrated bets, since recoveries can be uneven.
A buyer-intent checklist before implementing any strategy:
- Define required returns and maximum acceptable drawdown.
- Decide whether your goal is income, growth, or a blend—this drives product choice and risk exposure.
If you act on valuation signals, execution costs and product structure can materially influence outcomes—especially for long-term investing where fees compound.
In a comparison of options, evaluate:
- ETF vs unit trust vs managed portfolio: ETFs can offer cost efficiency; managed solutions may suit investors who value delegation and behavioural guardrails.
- Currency exposure and hedging: Understand SGD versus USD (and other) exposure, and whether hedging costs erode expected returns.
- Best platform fit based on your behaviour: If you trade frequently, low dealing and FX costs matter; if you invest monthly, automation and recurring purchase features can be more important than headline pricing.
Cost considerations to scrutinise:
- Transaction charges, custody fees (if any), FX spreads, and product-level expense ratios—total cost matters more than a single advertised fee.
- The platform’s product range (global ETFs, factor ETFs, bond funds) to support rebalancing when the indicator suggests adjusting risk.
Conclusion/Kesimpulan
The warren buffett indicator stock market framework is a useful valuation barometer, but it should be treated as an expectations tool rather than a market-timing signal. For Singapore investors, its greatest value is in refining risk-return assumptions and ensuring the portfolio matches investor profile fit—especially when valuations are elevated. Pair it with disciplined asset allocation, a clear rebalancing strategy, and a platform comparison that prioritises total fees and product breadth to improve the odds of achieving target returns over the long run.
Keyword: warren buffett indicator stock market